
One of the components of the game of baseball that intrigues me is arsenal crafting in pitching. In general, pitchers seek to couple pitches that tunnel together, until they split off into opposite directions. It’s what makes Yamamoto’s splitter so difficult to hit: The splitter stays on the same path as the fastball for a while until it wickedly diverges.
The more pitch types you can unlock in your repertoire, the more unpredictable you are as a pitcher. The result of unpredictability is imprecise timing by hitters leading to softer contact, given that strike throwing is decent. I looked for a way to quantify the effect of an expanded arsenal on the performance of pitchers league wide.
I sampled 140 qualified pitchers from 2025 season.[1]
I first looked for trends in wOBA, ERA and BA allowed as # of pitch types increased across the league. The trend lines were static. I think there was no evident link between # of pitches and ERA because the connection is indirect. The causal link is as follows:
Pitch Measures Peripherals KPIs
# of pitch types Barrel% ERA
Spin rate Hard Hit% wOBA
Velocity Chase% BAA
Movement Whiff% K%
Because the # of pitch types variable must pass through the layer of peripherals before affecting key performance indicators, a direct correlation between # of pitch types and ERA won’t be seen on a line graph. A pitcher with 7 pitch types could be ineffective in his location. A pitcher with 2 pitch types could be extremely effective with overpowering velocity. All that to say, the variables of velocity, location, and sequencing all make the effect of arsenal size noisy. However, I do believe we can quantify the effect of a large arsenal by looking further beneath the hood.
Knowing that peripherals like Barrel% are key indicators of sustainable pitching in the future, it’s useful to know how arsenal size contributes to these peripherals.
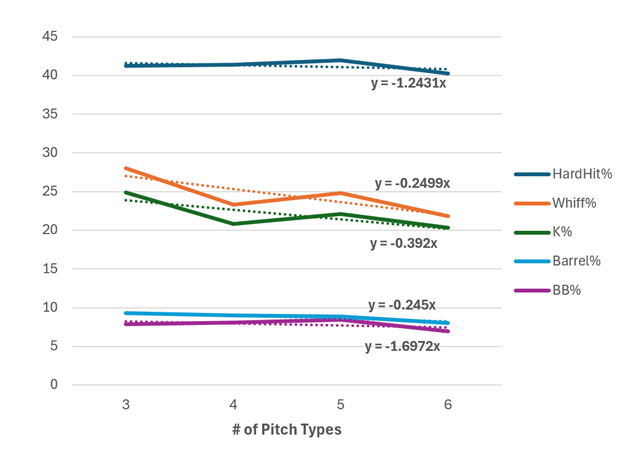
Each X coefficient gives the slope of the associated line: For example, Hard Hit% decreases by an average of -1.2 percent per added pitch type to the arsenal.
The following takeaways are evident about expanded selection of pitch grips / movements:
- It allows pitchers to evade barrels (-.24 slope) and hard hitting (-1.2 slope) by being unpredictable, mitigating the extra-base hitting ability of opponents.
- Walk rate decreases (-1.69 slope), likely because arsenal size is correlated with command
- Interestingly, pitchers with larger arsenals have lower strikeout rates. I believe that this isn’t because more pitch options = less whiffs, but that pitchers that throw softer often must have more pitch options out of necessity. Therefore, I think the explanation is that velocity is the big indicator of K%.
I think that this exploration shows that pitching arsenal size is a significant way for pitchers to prevent extra-base hits, especially if they throw softer than the average big leaguer. But for any individual pitcher, it’s clear that having a plethora of weapons is beneficial.
My next step would be to create a dashboard that runs on a multi-level linear model predicting both peripherals and KPIs from pitch metrics.
[1] Joined performance data on pitch usage data, then calculated # of pitch types > 5% usage for each player.

Leave a comment