Swing speed is a metric that was released by MLB statcast in the 2024 season. MLB analysts have emphasized the significance of the measure since its release. The quantification of bat speed (mph) revealed a strong association with hard hit rate. This is a key learning circulated around baseball as they’ve leaned into hard contact over batting average.
The mania surrounding hard hit rate (% of BBE >95 mph) and Barrel rate (% of BBE with optimal exit velo/launch angle combo) can be likened to the 3-point revolution in the NBA. In that case, it was recognized by analysts that the output of a 3-pointer being +50% more valuable than a mid-range shot vastly outweighed the discrepancy in degree of difficulty. Kirk Goldsberry wrote in Sprawlball that a mid-range shot was worth about .85 points per shot while a three-pointer was worth about 1.10 points per shot (from 2013-2018). Data driven insights such as this one often are over-simplified in order to gain traction. The majority of the basketball world heard this takeaway as “3-pointers are better than mid-rangers”. However, like most things, that is only conditionally true. What if the 3-pointer is off the dribble or highly contested? The value of shot types depends on your unique skillset as well. Ultimately, the sound bite of “3-pointers are better than mid-rangers” is generally useful in directing your catch and shoot opportunities for role players to the 3-point line. When all the teams catch on to this, it boosts the league’s offensive efficiency as a whole. But then you’re left to find other ways to seize an edge on the margins.
I draw this comparison from 3-pointers to swing speed because much like in the NBA, the MLB has come to an apparent consensus on prioritizing the upside of hard contact, despite strikeouts. Swing speed is strongly correlated with hard hits and barrels this year as seen below, as well as to blasts (hard hits that are squared up):
Correlation Matrix
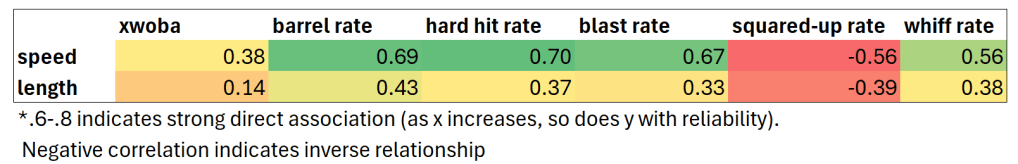
The big headline here is that bat speed leads to top end run creation. However, much like the 3-point revolution, the big headline can be an over-simplification for the sake of accessibility. Moreover, teams need to examine surrounding variables to assess improvement in the margins. So, as seen in the matrix above, despite the allure of a fast bat, swing speed is also directly associated with whiffs and strikeouts, while inversely correlated with square-up rate.
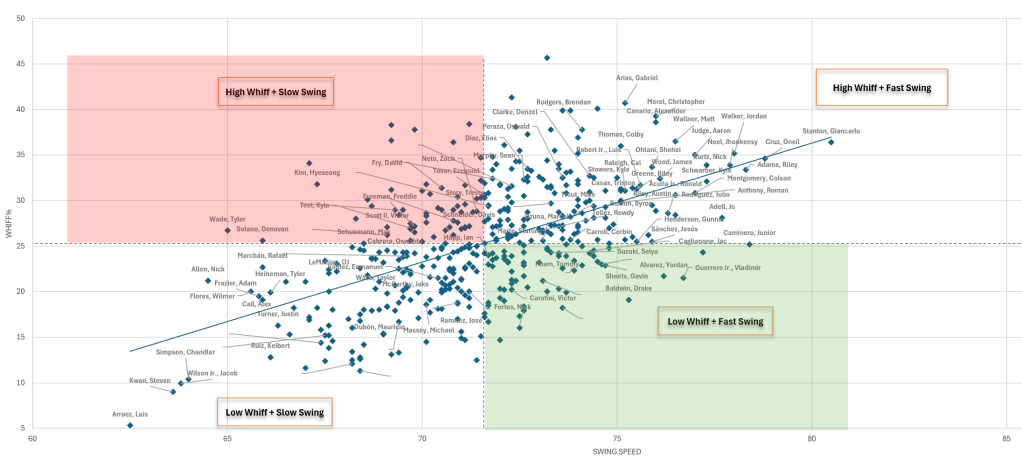
Swing Speed vs Whiffs tradeoff
Swing Speed vs Square-Up Rate tradeoff
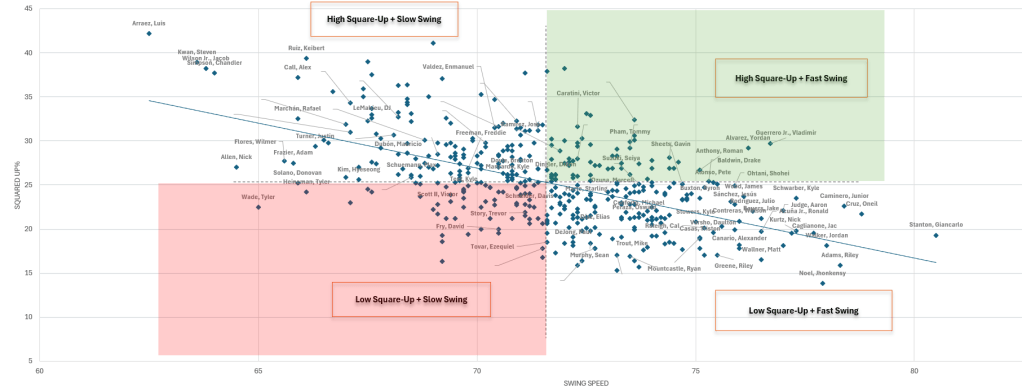
Players that swing hard make contact less on average and with lesser ability to square up, but we’re seeing that the tradeoff is worth it given that fast bats have higher wOBA (.38 correlation coeff between wOBA and swing speed). But given these correlations, what if we can optimize swings by getting the upside without sacrificing the contact?
For that I look to the swing length row on the correlation matrix. You can see it follows the same trends as swing speed but with weaker associations. This is an indicator that swing speed is the operating variable here with swing length probably being a proxy for swing speed. But out of curiosity, I wanted to see if swing mph per foot of swing length gave any interesting results. Perhaps players with a high “swing efficiency” would have higher contact rates while maintaining power.
Swing Speed vs Swing Length
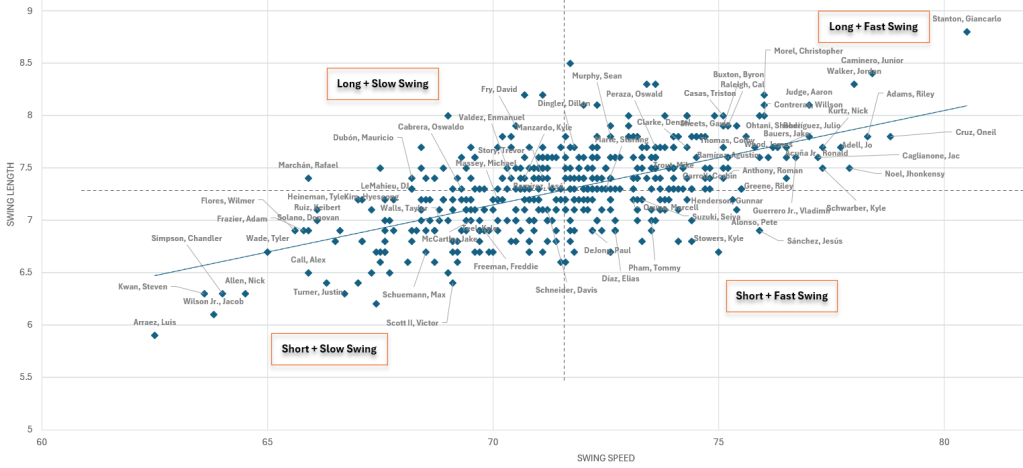
As established, players that have fast swings, have long swings on average. Players like Gunnar Henderson and Vlad Jr however circumvent the trend by having fast but short swings (lower right quadrant). How do players like this fare in the stat sheets? the following table is sorted by swing efficiency (for ex: 3.0 z-swing eff = 3 standard deviations above average swing efficiency), for players with above average bat speed:
Swing Efficiency Leaderboard (for players with above avg Swing Speed)
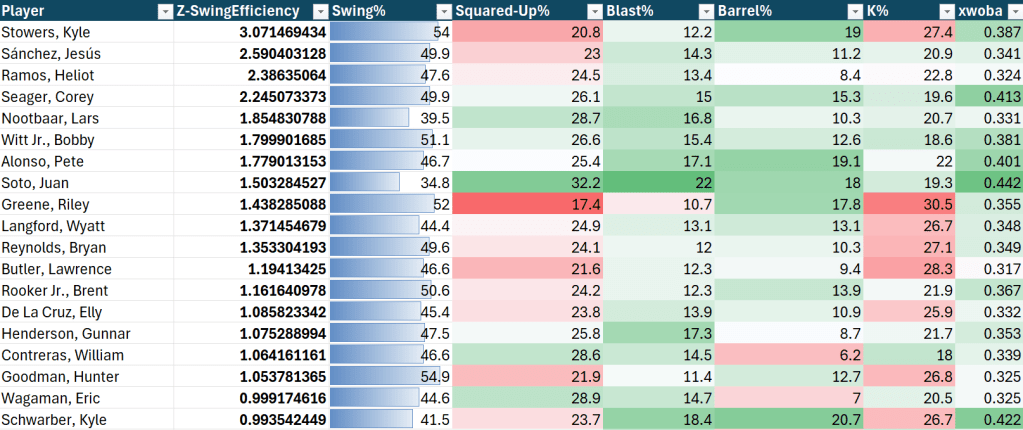
The table exhibits all the players this year that are at least 1 standard deviation above average. Swing efficiency isn’t strongly correlated with any result. That’s because the primary indicator is still swing speed alone. Still, we’re looking to find insights on the margins here. In general, at the players in the top of the swing efficiency leaderboard with a swing% below 50 tend to square up the ball more often (Like Corey Seager, Pete Alonso, Juan Soto, Gunnar Henderson). Pairing these attributes of powerful/short swings and plate discipline reveals a way to have power without compromising contact. It’s possible that the real differentiating factor here is selectivity in swings, which is worth exploring.
Although bat speed will remain the coveted measure for MLB teams, I think there’s value in pairing conversations about bat speed with selectivity and swing length.
That’s the story of the 2025 Blue Jays postseason run, a team that was projected to miss the playoffs by many. This article by Mike Petriello exhibits how the Blue Jays used swing data to surpass expectations: Blue Jays offensive success in 2025 playoffs. The Blue Jays had the lowest strikeout rate this year (18%), but struggled to generate slugging. This year, they focused on boosting their bat speed, as exhibited in the visual below, while preserving their ball-in-play approach. I think this speaks to the balancing act that’s necessary in obtaining an edge nowadays. Every team wants bat speed now, but the blue jays demonstrated that you could have both by starting with a contact-based focus and refining speed to increase power.
There’s more research to be done on this topic, especially in lineup construction. How do teams that have all home-run geared players compare to teams with a variety of player types? Is it easier to refine contact ability when starting with plus bat speed, or the other way around?

Leave a comment