
All of the popular statistics in the baseball zeitgeist offer a way to summarize a player’s contributions in terms of what they do on average. Batting average, on-base percentage, walk percentage, chase percentage, etc. Averages are obviously valuable in that they reveal a player’s true contributions over the course of many plate appearances.
However, I don’t think that teams consider variability enough in their assessment of player stats. When dealing with any summary statistics, there are two elements that characterize it: mean (average) and variance.
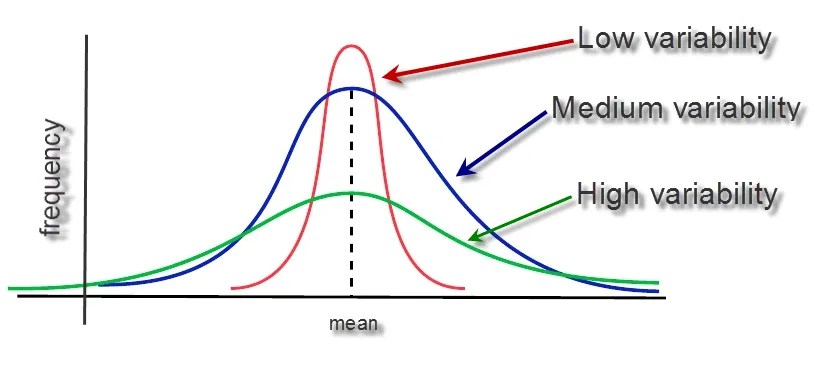
All three of these distributions have the same mean. They differ in their variance. The red curve has the tightest range of outcomes, while the green has the most fluctuation. So, if each curve represented a different baseball player’s wOBA, the red player would be the most consistent, while the green player would be the most unpredictable. The green player has both the lowest floor and the highest ceiling. In this way, variance is an important second element to consider in evaluations. If you have a team with lots of reliable hitters but with limited power, you might opt for the green player in hopes of adding more potential while sacrificing consistency.
Variance is the backbone of inference in the methodology of statistics. Knowing the distribution of a player’s batting average allows you to construct a confidence interval in which about 95% of their outcomes are captured. Knowing the behavior of a stat over time then allows you to determine the significance of specific observations. It’s how people in the medical field evaluate whether a change in recovery rate seen on a new drug is significant, or due to chance. It’s how businesses evaluate whether an increase/decrease in sales was due to a specific commercial, or due to chance.
Yet, MLB circles continue to only use averages. They view the green curve and the red curve in the same light. I think Aaron Judge’s World Series performance last year was an example of how variance could’ve been utilized.
In 2024, Judge got off to a cold start. He was hitting .220 in April. But when you look at his 2024 averages as a whole, he had one of the best seasons ever: .322 average, .458 OBP, .476 wOBA.
Clearly, if we examined his production month by month, there was lots of fluctuation. His low performing months and astronomically high performing months averaged out to a superb season. I think that came back to bite him in the World Series when he batted .222. To many fans, it was shocking that the best hitter in the MLB was a no-show in the biggest games. If you include variability in your evaluations, it seems more likely.
What’s a sufficient way to describe the range of expected outcomes for a player?
In the MLB, a comprehensive metric that captures player value is wOBA. Essentially, it is on-base percentage, but with appropriate weights on each type of hit (double, triple, HR). It captures the player’s ability to create runs with both contact and power. I wanted to use xwOBA (expected wOBA based on exit-velocity and launch angle of hits), and give a confidence interval based on the variance of this metric for each player.
The best bet I had to encapsulate variance was using strikeout rate as a proxy. Using strikeout rate * xwOBA as the variability for each player, constructing lower and upper bounds for their performance.
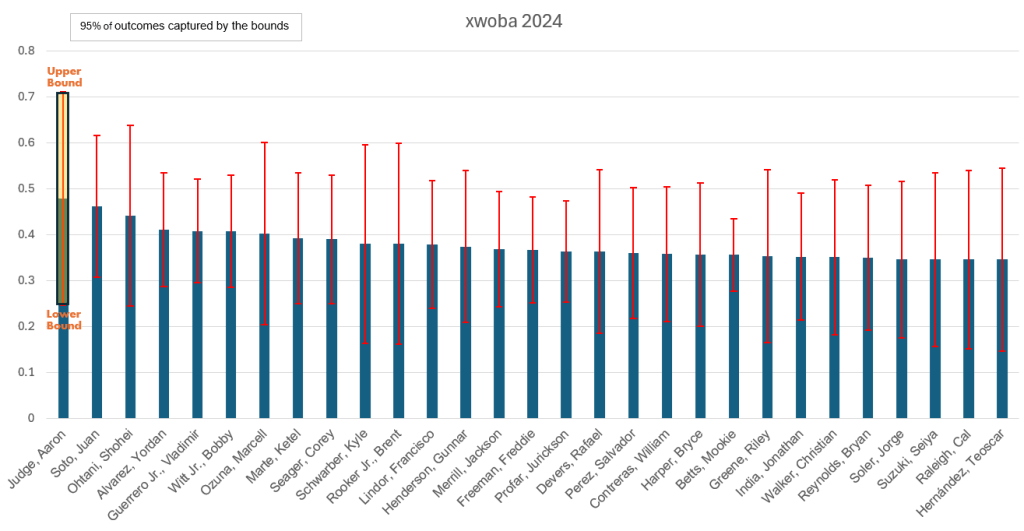
You can see that Judge led the league in xwOBA, but with a larger range of outcomes than other top performers. Soto had a similar xwOBA, along with a tighter range of outcomes. Vlad Jr and Bobby Witt also ranked highly, with low variance.
Other high variance players by this model include Rafael Devers, Riley Greene, Cal Raleigh, and Teoscar Hernandez.

Leave a comment