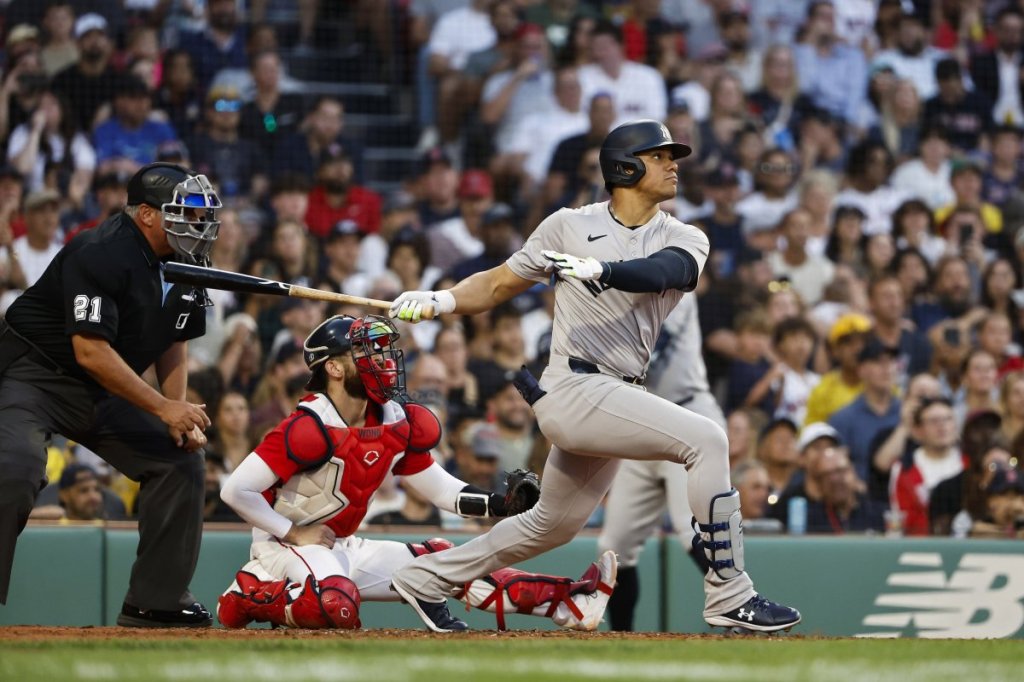
So there it is – Juan Soto to the Mets for $765 million – the largest contract in sports history. During MLB free agency, there’s a whirlwind of chatter about which player your favorite team should sign. At some point, you might have scrolled into a tacky photoshop of Juan Soto draped in a Mets, Blue Jays, Dodgers, or Red Sox jersey. It may have been accompanied by an illegitimately sourced news update on how Juan Soto was “interested” in your team.
Of course, Juan Soto was the premium commodity of 2024 free agency. His insane contract value is due to execs clamoring over the concept of locking up a top 5 player at only 26 years old for a decade plus… But the question I sought to answer was: how does Soto’s value change departing the lefty-friendly Yankee Stadium? Can we estimate his what his theoretical change in production would’ve been moving to a place like Fenway Park in Boston? And finally: Does this information change approaches to signing big-ticket free agents?
Of course, regardless of ballpark, Soto is an elite talent. His 137 OPS+ (adjusted for ballpark) indicates he was about 37% more productive than the average MLB hitter in 2024. However, to investigate my question, I turned to baseball savant’s website which displays ‘park factors’. Essentially, park factors demonstrate how hitter-friendly a ballpark is. For example, Yankee Stadium had a 113 HR factor in 2024 for left-handed hitters, meaning that 13% more home runs were hit at Yankee Stadium by lefties than in away games (by Yankee hitters and Yankee opponents).[1] These factors can help us understand how a player’s statistics will translate when playing their home games in a new park. To briefly summarize my methodology, I pulled left-handed Yankee Stadium park factors (for OBP, singles, doubles, triples, HRs) from baseball savant , all years since 2009. I used 3 year rolling average park factors to reduce random noise from year to year. Meaning, the 2024 park factor numbers are the average of those from 2022-2024. I wrote a function in R to revert Soto’s home statistics to a neutral environment, based on these park factors. For example, since the average park factor on HRs for lefties throughout all seasons was 129, I reduced Soto’s HR total at home by 29% to neutralize it.
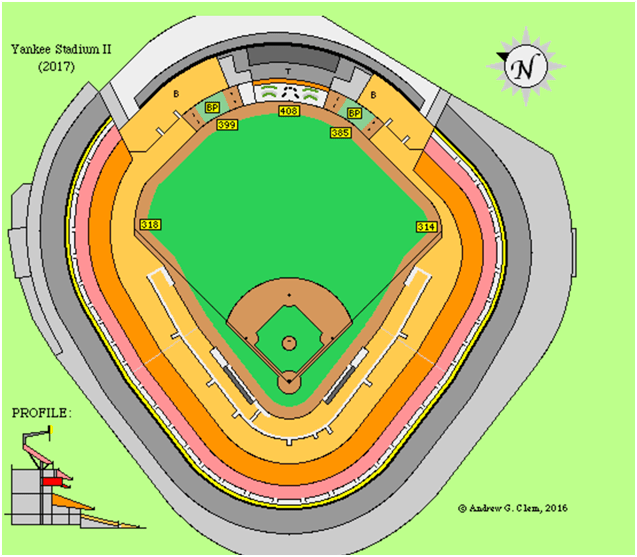
Figure 1: Yankee Stadium wields a shallow right field relative to average with the shortest wall (8ft), garnering the name “short porch”.
The next step in translating Soto’s home statistics was to pass the aforementioned neutralized stats into another function that leveraged Fenway’s park factors. The result was Juan Soto’s estimated statistics as a Red Sox player in 2024[2]:
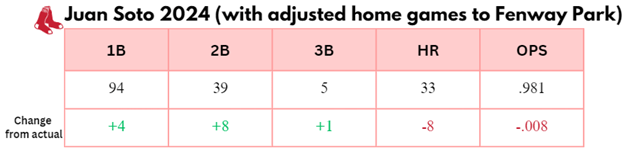
Figure 2: Juan Soto’s estimated production if he played for the Red Sox in 2024
Ultimately, Soto’s total impact on run creation doesn’t change much, with his OPS at .981 as a member of the Red Sox opposed to .989 on the Yankees this year. The interesting alterations reside in the components of the OPS. Soto’s production is allocated differently among hit types when his home games are played at Fenway: singles project to increase by 4, doubles hitting boosted by +25%. Triples stay relatively constant, while home runs take a -8 hit from 41 to 33.
Figure 3: Fenway’s 37 ft tall Green Monster begins at 310 ft distance on left field line to 379 ft in left center
Moving from Yankee Stadium’s avg LHH HR park factor of 129 to Fenway’s 85, Soto’s home run prowess is expected to be mitigated. As you can see in Figure 3, the right-center field (where most left-handers pull homers) in Fenway is expansive relative to Yankee Stadium. Fenway’s right-center spans 380-420 ft while Yankee Stadium sits at 314-385 ft (~10% more shallow). However, he almost fully compensates for this reduction in home runs with +9 more estimated extra-base hits and +4 singles. Presumably, he’d be exploiting the unorthodox geometry of Fenway Park. He would benefit from Fenway’s 134 avg doubles factor for LHH, opposed to Yankee Stadium’s 90. With the Green Monster pulling strings in left field, Soto would pelt the wall with opposite field knocks that would be flyouts in other parks. Fenway’s awkward build can cause balls in play to bounce around like a pinball.
Soto evidently would have been a productive bat in Fenway, but $765 million’s worth? Not to be a hater, but that’s a tough sell. Constructing a competitive baseball team is not the same as piecing together an NBA team. In basketball, the positions are meaningless relative to their on-court roles. There are no rules preventing a ‘Center’ from doing anything a ‘Point Guard’ does. All players can play from any area of the court, on offense and defense, and shoot as many times as they want regardless of their ‘position’. They can have any 5 players on the court. So, it makes sense that adding 2017 Kevin Durant to your team is purely additive, since you don’t have to worry about having space for him in one ‘position’. However, in the case of what could have been a Red Sox signing of Soto, it didn’t seem like the best use of resources.
Take this extreme example: Say a team has 5 all-star outfielders, and a scarcity of quality infielders and pitchers. All their money is dedicated towards their star outfielders, so they resort to minor league level talent elsewhere. The surplus of outfielders, in this case, is hurting the quality of the team. They could dispense of a star outfielder in favor of better pitching, since only 3 outfielders can play at a time anyways. I think you see where I’m going with this thinly veiled allegory. Although I understand the ‘pursue generational talent and figure the rest out later’ approach – in which teams acquire elite talent and re-construct the roster around it – I don’t think that applies here. Already composed of what I believe are elite hitting talents like Rafael Devers and Triston Casas, the Sox also hold sort of an abundance of talented outfielders. Jarren Duran (MLB leader in doubles and triples), Ceddanne Rafaela (AL rookie leader in RBI, Hits, Runs), Wilyer Abreu (RF Gold Glove) and others. Even though the Sox were 81-81 and missed the playoffs, they had the 7th best OPS in the MLB and 6th best SLG. This was countered by their below average team ERA (4.04), and bullpen ERA (4.39, 24th ranked). Nevertheless, I understand the push for Soto. He has preeminent plate discipline and hitting ability at only 26. He already has 4 seasons with both 25+ HRs and 125+ walks (4th most in MLB history). But to shelve out 700+ mil for one player in a superfluous position on a team that already hits well seems imprudent, especially given that the pitching staff is begging to be improved. The final point I’ll add here is that the best Red Sox hitters are already all left-handed (Devers, Duran, Casas). This gives them an obvious weakness against left-handed pitching, evident in a 20-point decrease in OPS and slugging vs lefty pitchers instead of righties in 2024.
These factors seem indicate that the Sox were better off targeting SP Max Fried (now a Yankee), and righty power bat Teoscar Hernandez in Free Agency. The Garrett Crochet trade news just hit today, and it seems like a move that makes a lot of sense to me.
First off, on the defensive side, Sox are in desperate need of a lefty starter given that all their current starters are right-handed. But circling back to park factors, I think that they advocated for the signing of Max Fried. The 3 year rolling park factors on the Braves’ Truist Park indicate that Fried has played in a park that allows 5% more homers than average. Even so, he has the second-lowest rate of home runs allowed in this decade (1st – L. Webb). Contrast this with the fact that Blake Snell was pitching in the most pitcher friendly park in terms of home runs in 2024 (Oracle Park, 78 HR factor), and I liked the idea of Fried to the Sox much more. Not only that, Fried has also allowed the sixth-lowest rate of doubles allowed per batter since 2020 (per Michael Rosen and baseballsavant). Given that Fenway sports the highest doubles park factor (124), Fried would’ve been the perfect candidate to challenge the influence of the Green Monster. Alas, at least they landed Crochet in the trade market.
In this fascinating article, Michael Rosen explores how much of Fried’s success on balls in play he’s responsible for. Incidentally, Fried’s uniquely unpredictable and deep pitch mix allows him to significantly prevent the hitter’s ability to lay a huge swing on his pitches. The wide discrepancy in movement and velocity between these pitch types, Rosen postulates, is a big factor in Fried reducing barrels (Fried was 89th percentile in barrel rate, 95th percentile in avg exit velocity in 2024). His curve (21% usage) had the fifth-most induced drop out of any pitch in 2024.

Figure 4: Max Fried Pitch Movement Plot 2024 per Michael Rosen, FanGraphs
In fact, Max Fried utilized four “plus” pitches by total Run Value in his toolbox in 2024 (Curveball, Sinker, 4-Seam, Changeup).
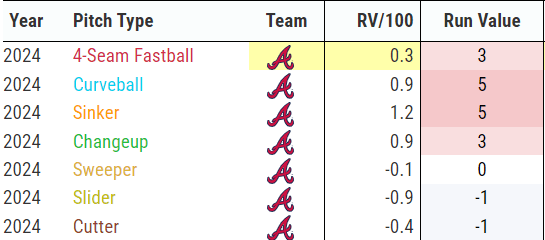
Figure 5: Fried Pitch Types, per baseballsavant
These facts about Max Fried’s versatile arsenal support the hypothesis that he can replicate his specialty in mitigating hard contact in other environments.
I also like the idea of signing Teoscar Hernandez since Tyler O’Neill’s departure. As I alluded to, they could balance out the lineup with right-handed power. I thought it would be interesting to examine what Teoscar’s stats as a Red Sox player could look like:
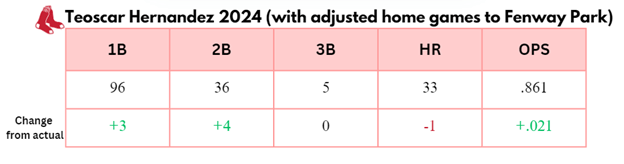
Figure 6: Teoscar Hernandez estimated stats as a Red Sox player in 2024
In my study of Teoscar, I estimated that his OPS would see a 20-point boost in Boston’s conditions versus Dodger Stadium. Contrary to Soto, Teoscar’s HR numbers stay relatively constant in the move to Fenway for home games. The reason for this is that Dodger Stadium’s avg home run factor for RHH (103) is not nearly as extreme of a boost as Yankee Stadium’s is for LHH (129). In addition, Fenway’s HR factor for RHH (96, 4% decrease from avg) is slightly more friendly than the adjustment Soto received (85, 15% decrease). This results in Teoscar’s relatively stable HR total. Add on the favorable bump Teoscar gains from Fenway’s 117 avg RHH doubles factor, and he’s estimated to have 4 more doubles.
Ultimately, in this exercise, Juan Soto’s adjusted OPS of .980 still outpaces Teoscar Hernandez’s by more than 100 points. But the point remains, the value play could be Teoscar, given that he’s a righty and estimates output the exact same number of homers as Soto as a Red Sox player (33). Teoscar’s total contract value probably ends up being less than 1/7th that of Juan Soto, so they should be able to sign many more key pitchers.
[1] A confounding factor not accounted for in these estimates is Soto’s batted ball profile. For example, if he hits opposite field significantly more or less than other left-handed hitters, his stats will have to be adjusted differently.
[2] Park Factors eliminate the confounding factor of team ability. In this example, they only compare runs scored in Yankee Stadium to other Yankee games played elsewhere.
